- Zenity Labs
- Posts
- Threat Actors Are Already Scanning For Your AI Deployments and Middleware
Threat Actors Are Already Scanning For Your AI Deployments and Middleware
What recent scanning activity means for your AI middleware and agentic deployments

GreyNoise recently published an analysis of the first large probing and reconnaissance campaign against AI deployments observed in the wild. The activity, which was captured through honeypots and confirmed by independent researchers, marks a shift from theoretical AI attack surface discussions to measured, repeatable, internet-scale behavior.
GreyNoise reported two distinct but adjacent campaigns, between October 2025 and January 2026:
Large-scale LLM endpoint enumeration
SSRF-style probing via AI-related functionality
In this blog post we’ll focus on the latter, both because it’s more relevant to general AI application deployments and since we estimate it’s more probably to have been invoked by threat actors and not researchers.
TL;DR:
AI attacks are now real and observable. GreyNoise documented the first large-scale, real-world reconnaissance campaigns targeting AI deployments—not theoretical risks.
Attackers aren’t hitting OpenAI or Claude directly. They’re probing enterprise-controlled AI layers: gateways, proxies, agent backends, middleware, and self-hosted runtimes. With the goal of mapping deployments and building a target list.
In this post we dive into how you can hunt for this malicious activity in your agentic applications. Covering popular platforms including AWS Agentcore, Azure AI Foundry and Microsoft Copilot Studio. This is a detailed dive into each platform including where you can find the logs, what to search for, and how to ensure you have proper monitoring and observability into your AI deployments.

Attack campaigns timelines, as published by GreyNoise
Large-scale LLM endpoint enumeration
This recon campaign, which started late December, focused on enumeration of LLM-facing endpoints. The apparent goal was to:
Identify misconfigured or unauthenticated AI proxies
Test responsiveness of endpoints exposing OpenAI-, Gemini-, and Anthropic-compatible APIs
Fingerprint available models and supported request formats using simple prompts, which were directed to conversational endpoints
Crucially, this activity does not appear to target either SaaS LLM providers directly or cloud SaaS agentic platforms directly. Instead, it appears to have targeted customer-operated infrastructure: AI gateways, middleware APIs, agent backends, and self-hosted deployments. Furthermore, it’s important to note that enumeration at this volume usually implies pre-selection and possibly OSINT methods, and not blind active scanning.
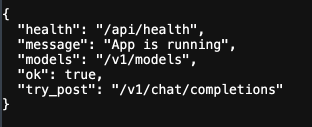
An example of a deployed AI API endpoint seen in the wild
What was likely targeted (and what was not)
A key takeaway from the GreyNoise report is that the attackers were not “hacking OpenAI” or “attacking Claude.” They were probing the layer enterprises control and frequently misconfigure.
The likely target: AI middleware and AI deployments
Based on request patterns and GreyNoise’s own assessment, the most plausible targets were:
LLM proxies and gateways
“OpenAI-compatible” or “Gemini-compatible” API wrappers
Agent backends and orchestration layers
Self-hosted or developer-managed AI runtimes (e.g., Ollama deployments)
Components such as proxies and API wrapper used for AI systems are a sort of AI middleware, and often carry misconfigurations known from traditional application security. They often:
Sit between applications and commercial LLM providers
Are internet-accessible by design or accident
Expose predictable endpoints and schemas
Bridge directly to high-impact capabilities (model access, tools, data sources)
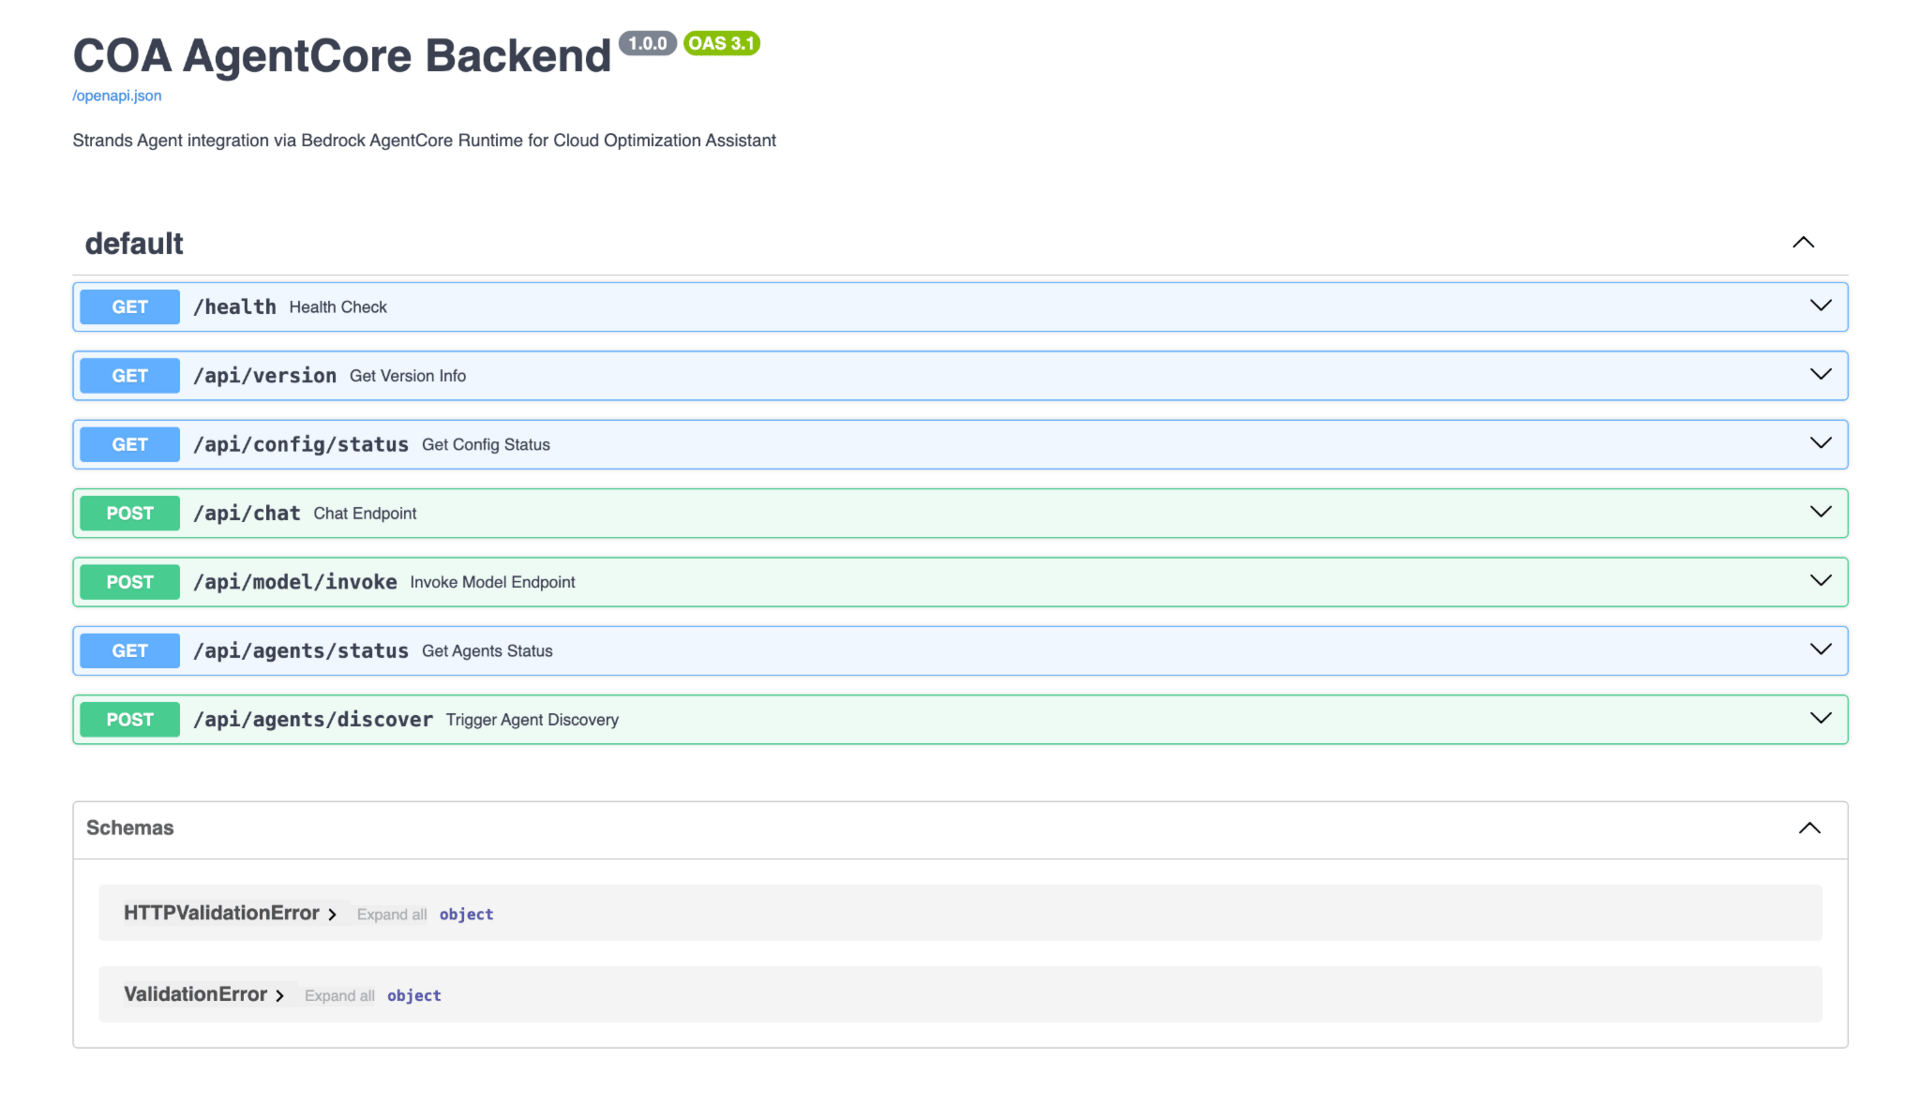
An example of an AI integration surfaces exposing API endpoints
What was Likely not the target
Native SaaS LLM APIs (OpenAI, Anthropic, Google-hosted endpoints)
Consumer-facing chatbot demos with no privileged backend access
This distinction matters, because the defensive responsibility sits with the builders operating the AI deployments and not the LLM providers and cloud platforms.
Why this matters for defenders
Reconnaissance is rarely the end goal, however, it is arguably the most important part of an attack chain. It is typically:
A way to gather information about applications and the organizations who build them
A discovery phase for later impact (e.g., tool abuse, agentic hijack)
A way to map which AI systems expose potential functionality worth exploiting
If your organization operates AI agents, copilots, or internal AI services, this type of activity is relevant even if:
You believe your models are “internal” - they may be externally reachable due to misconfigured gateways, development endpoints, or “temporary” exposures created during testing and integration.
You are not using custom prompts or plugins - attackers often target the execution layer of the AI application (API routing, tool invocation, outbound requests), and not prompt logic per se, and can extract value from access even when prompts are static.
You rely on managed AI platforms - while the underlying models and hosting are managed by the provider, the surrounding application logic, integrations, and access controls remain your responsibility. This is no different from classic cloud security best practices.
Why callback domains are especially important IOCs to spot
One of the most interesting aspects of the reported activity was the use of *.oast domains as callback infrastructure. While out-of-bounds testing is a familiar technique in traditional web security in the context of creating ephemeral server-like functionality for incoming web requests to verify different exploits, such as SSRF (there are many other such domains as well - *.oast is just one of them).
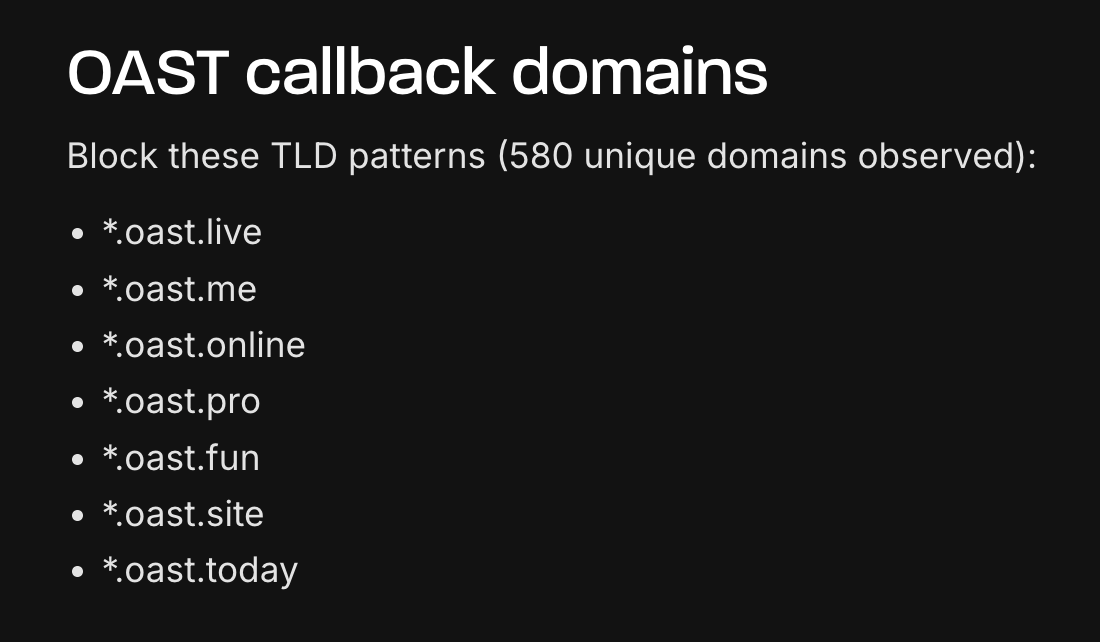
This is especially meaningful for AI systems - if these calls are successful they will indicate that user-controlled input influenced runtime behavior (e.g., tool invocation) and hijacked the application into initiating an outbound request. In other words, including these type of callback domains signifies that these are attempts to create PoCs for agentic or tools hijacking.
Threat hunting, step by step
The following sections translate the reported activity into platform-specific actionable threat hunting steps for similar activity, highlighting where AI builders and security teams should focus their attention.
Even if you are less familiar with each platform’s more elaborate analysis tools (a process that can be time consuming and often requires elaborate setup and permissions), we’ve focused on the clearest tools and queries to start with.
We’ll be focusing on some of the prominent agentic platforms:
AWS Bedrock AgentCore
AWS Bedrock AgentCore provides agent runtimes deeply integrated with AWS infrastructure, allowing agents to invoke AWS services, access resources, and operate within customer-defined networking boundaries. It is active by default (assuming you’ve added Agentcore observability).
Practical threat hunting
Where we find the logs
For AWS AgentCore deployments, CloudWatch is the primary source of telemetry for threat hunting. Most of what we will focus on is located in the Logs section. The starting point is CloudWatch Logs Insights, where you can select one or more relevant log groups, ideally beginning with your Agentcore runtime resource itself, and then expanding to related components as needed.
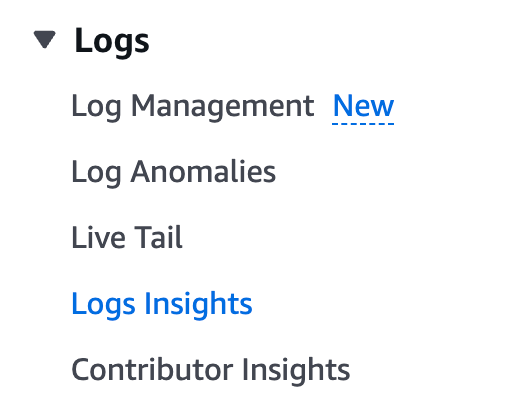
Relevant log groups can be identified through CloudWatch Log Management, where available groups can be browsed and searched directly before being queried in depth.

Logs Insights provides an SQL-like query interface that enables flexible, full-fidelity threat hunting across agent execution, tool invocation, and runtime behavior.

Searching for anomalies
Outgoing traffic to out-of-bounds domains
Unlike passive prompt probing, outbound requests confirm that the agent crossed a critical boundary from processing input to executing actions with network reach.
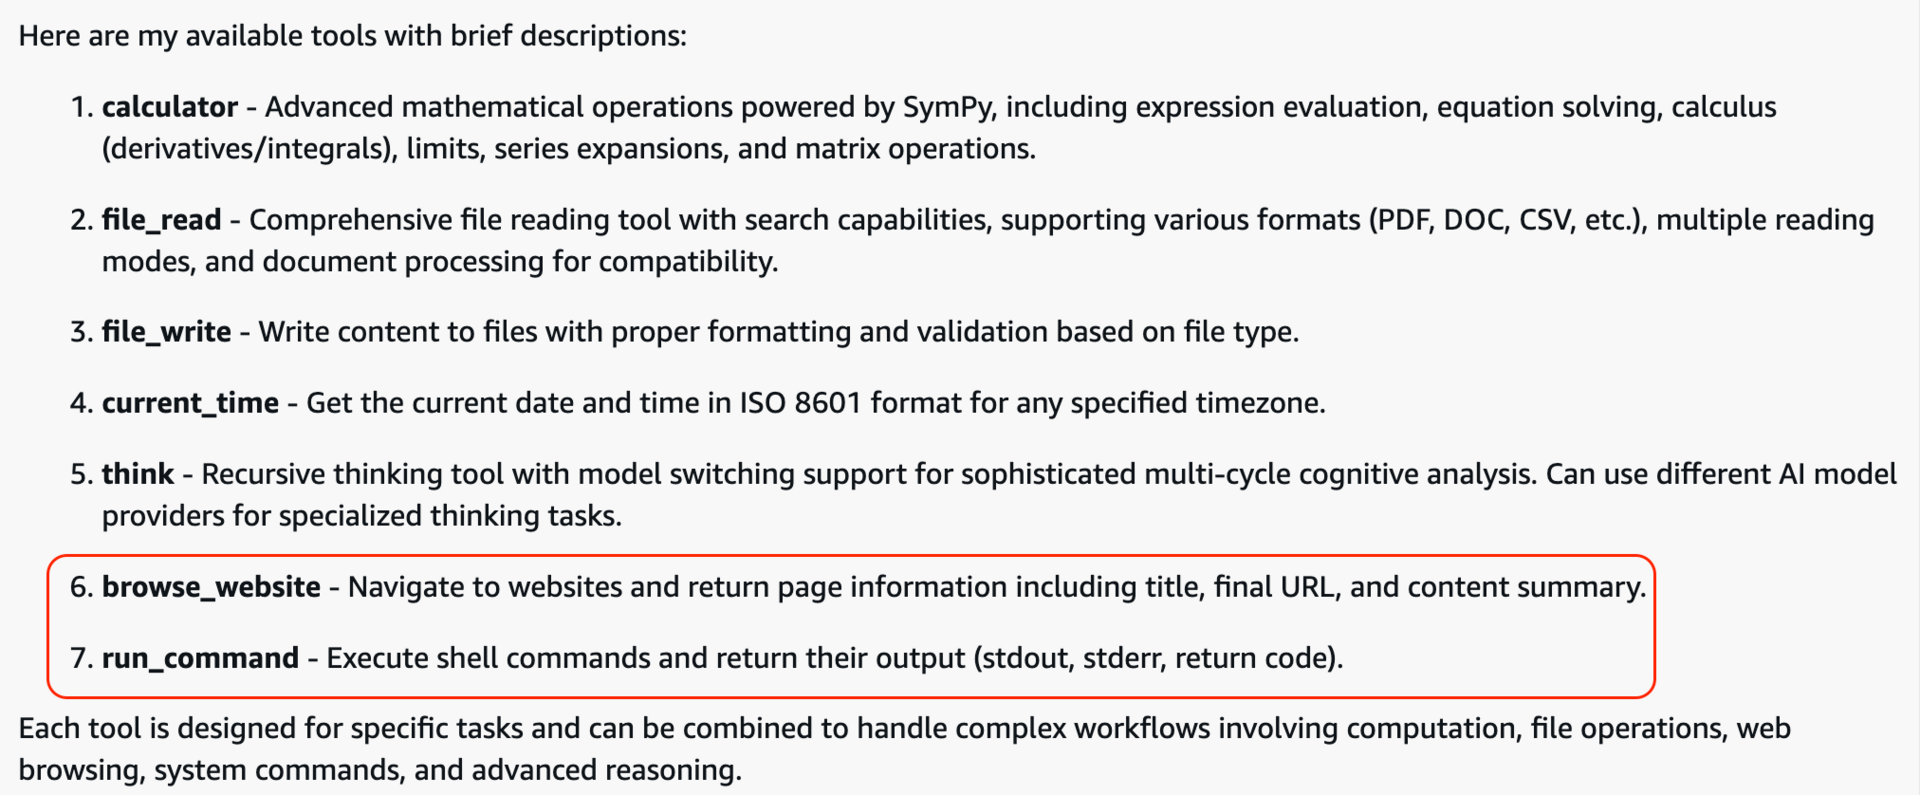
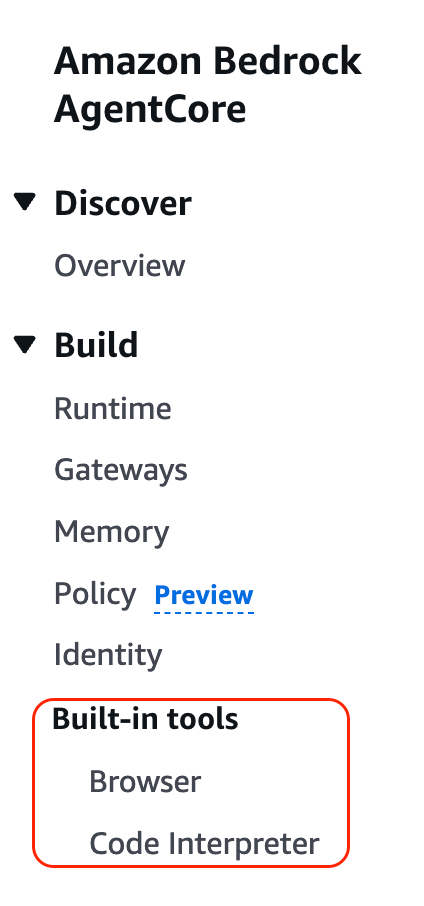
An example of tools with outbound connectivity in a Bedrock Agentcore agent
In other words, in most modern agent platforms, tools are the execution surface. Agents can initiate outbound requests through several mechanisms, including:
Web search or HTTP tools, where the destination URL or query is derived from user input
Predefined tools and connectors, which abstract outbound API calls but still accept externally influenced arguments (in Agentcore, there’s a built-in Browser tool with this capability)
Knowledge retrieval mechanics, where documents or references hosted on public domains that might be fetched at runtime
For these reasons, outbound requests to unexpected or external domains should be treated as a high-priority hunting signal.
Find outbound URLs to domains outside of your allowlist
The query below extracts URLs from log messages and highlights destination hosts that do not match an expected allowlist (using google.com here as a stand-in example):
fields @timestamp, @message
| parse @message /"(https?:\/\/(?<host>[^\/"\s]+)(?<path>\/[^"\s]*)?)"/
| filter ispresent(host)
| filter host not like /(^|\.)example\.com$/
 and host not like /(^|\.)api\.example\.com$/
 and host not like /(^|\.)amazonaws\.com$/
| stats count() as hits, min(@timestamp) as firstSeen, max(@timestamp) as lastSeen by host
| sort hits desc
Spotting early signs of agent abuse or misconfiguration as baseline discovery
Deep dive into activity for a specific destination or session
Once a suspicious domain is identified, the next step is to correlate it back to agent sessions and executions:
fields @timestamp, @message
| parse @message /"(https?:\/\/(?<host>[^\/"\s]+)(?<url>\/[^"\s]*)?)"/
| parse @message /"session\.id":"(?<session_id>[^"]+)"/
| parse @message /"aws\.agent\.id":"(?<agent_id>[^"]+)"/
| filter host like /google\.com/
| display @timestamp, agent_id, session_id, host, url, @message
| sort @timestamp desc
| limit 200
Detecting known-bad IPs: considerations and limitations
One challenge in IP-based detection is that AgentCore does not automatically log frontend client IP addresses. This is expected: the agent runtime typically sits behind infrastructure you control as the builder.
As a result, IP tracking must be explicitly implemented at the frontend or application layer. One practical approach to handle this is to:
Capture the client IP at the frontend (for example, via X-Forwarded-For)
Propagate it to the agent runtime (e.g., as a request header or context field)
Pass it on it into CloudWatch logs as structured data which you can later query
This can be achieved by creating a custom AgentCore tool or runtime handler (for example, in Python) that logs execution context using the standard logging module (stdout / stderr). Once logged, these IPs will become first-class fields for threat hunting in Logs Insights.
Azure AI Foundry
Azure AI Foundry Azure AI Foundry acts as a control and orchestration plane for models, tools, and data sources, enabling custom AI applications and agents.
Practical threat hunting
Where we find the logs
Azure Foundry supports logging and tracing by using Application Insights. All you need to do to enable full tracing capabilities and visibility into your agents is connect Foundry to your application insights resource (as seen in the image below)

Once this is connected your agents’ activities are automatically traced. Including all tool calls, AI messages, user messages and overall agent runtime execution.
To see your agents logs you’ll need to navigate to your connected Application Insights resource and run the following query:
union
dependencies,
customEvents
| where timestamp >= ago({time_frame})
| where type == "AI"
| order by timestamp desc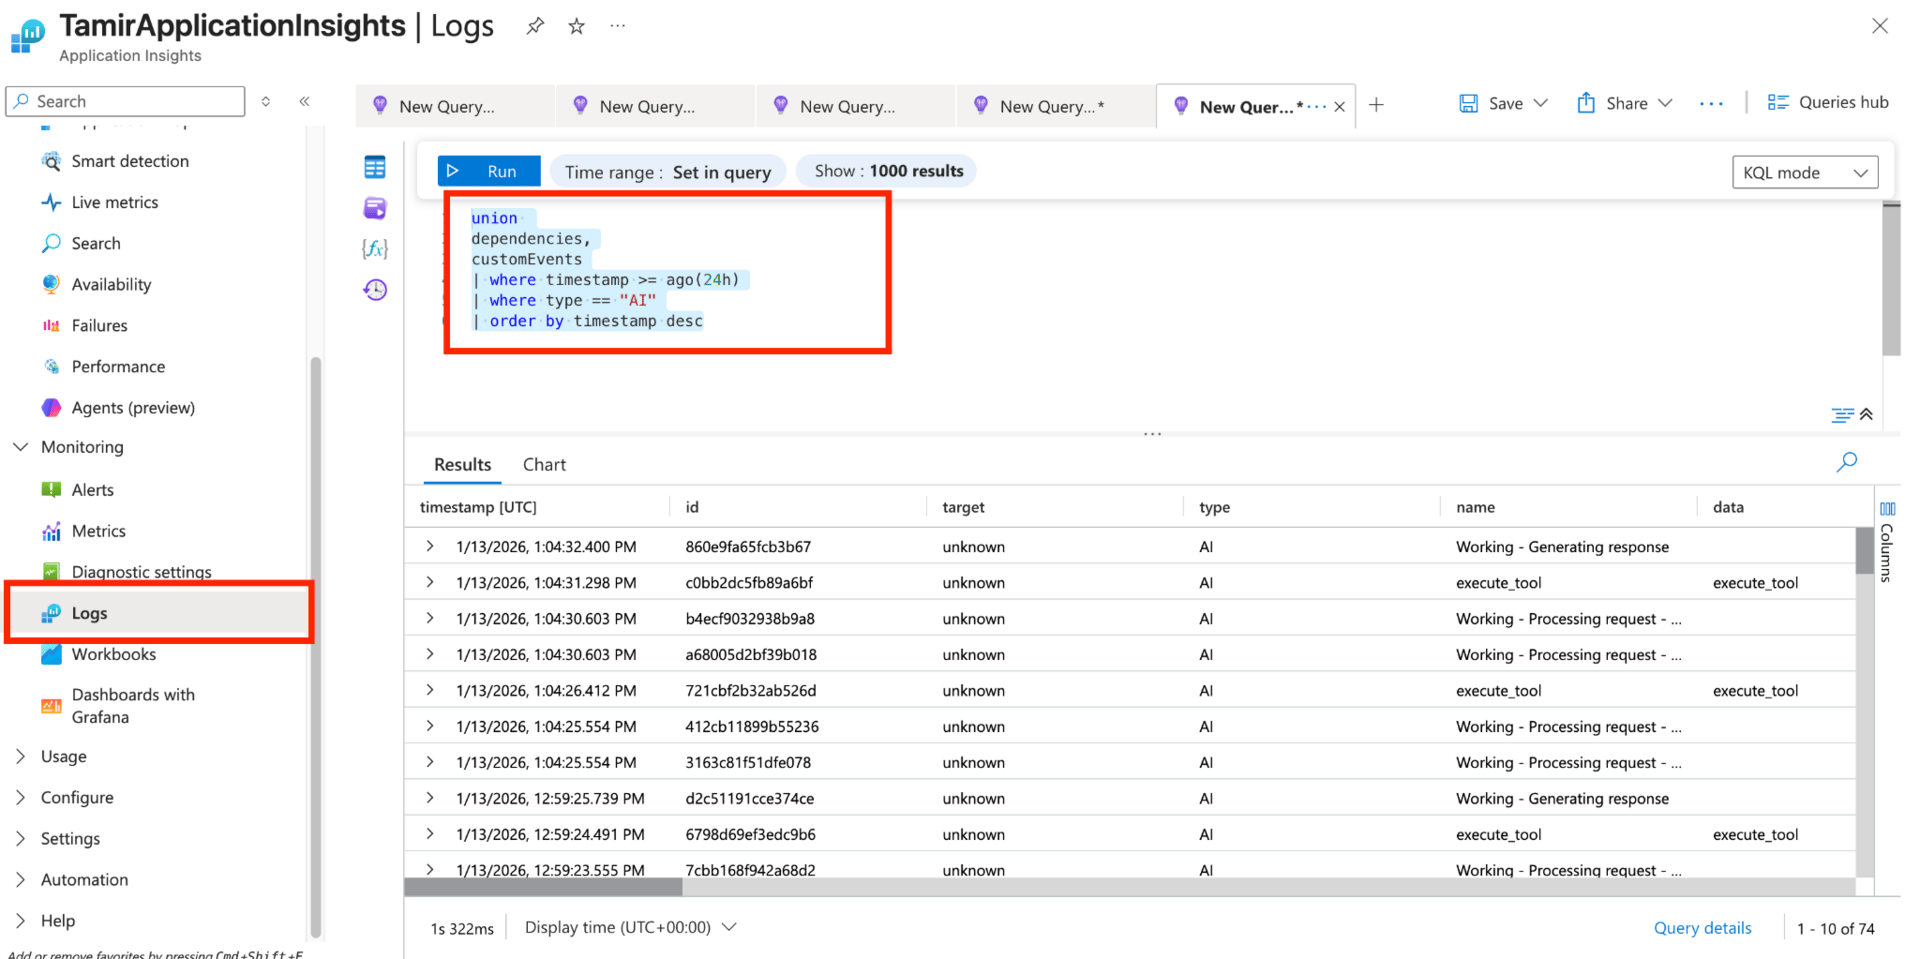
You can then filter more granularly by agent name, thread_id, activity type (tool execution, user message, AI response), etc.
Searching for anomalies
Outgoing traffic to out of bounds
Azure Foundry offers many ways to connect tools to your agent. From default ready-made tools such as web-search, browser automation and file search, to custom MCP servers and custom OpenAPI schemas.

preconfigured tools in Azure foundry
As mentioned earlier, in this specific recon attempt the attackers tried to establish a connection back to their OAST domains. This is done to map whether the internal infrastructure of the AI deployment allows for outbound traffic - something that can be achieved via tools which allow for web connectivity (such as web-search, browser automation, and others).
Searching all AI traces for the OAST domains should do the trick as the traces also contain all tool requests, responses, and overall activity.
Below is an example query for “*.oast.live”:
union
dependencies,
customEvents
| where timestamp >= ago(30d)
| where type == "AI"
| where tostring(customDimensions) contains ".oast.live"
| order by timestamp desc
Note that the original article mentions 6 more TLD patterns that need to be checked.
Searching for the specific patterns in the overall AI logs rather than in specific execution steps is our recommended approach. This is since traces of these OAST domains might also appear in user messages or AI responses - also indicating that your agents may have been targeted.
Detecting known-bad IPs: considerations and recommendations
Tracing IP addresses is a crucial aspect when it comes to securing your AI agents against adversaries. As pointed out by the GreyNoise report, IP addresses are many times indicative of malicious activity and are best traced to enable proper detection, response, and after the fact analysis.
While IP addresses are part of the Application Insights trace scheme, they are not automatically logged (as seen in the image below)

IP addresses default to 0.0.0.0 without additional configuration
In order to stay safe and provide full transparency into agents activities we recommend always enriching the default Application Insights logs with the IP addresses of the client interacting with your AI application.
This will require further setup and adjustments on the span traces themselves enriching the logs with front-end information about the current IP. Fortunately Microsoft are aware that this is a popular logging demand and have made a guide on how to adjust the default OpenTelemetry logs here.
Copilot Studio
Copilot Studio deployments expose conversational AI endpoints backed by low-code orchestrations, including embedded knowledge and external actions that can interact with organizational data and services.
Practical threat hunting
Where we find the logs
Power Platform logs, and especially audit logs and activity data, reside in Dataverse (a core data foundation for the Power Platform eco-system).
Dataverse is one of the easiest ways to view Copilot Studio audit logs, and we can do this directly in Power Apps -> Tables -> conversationalTranscript, within which you can filter activity based on its content.
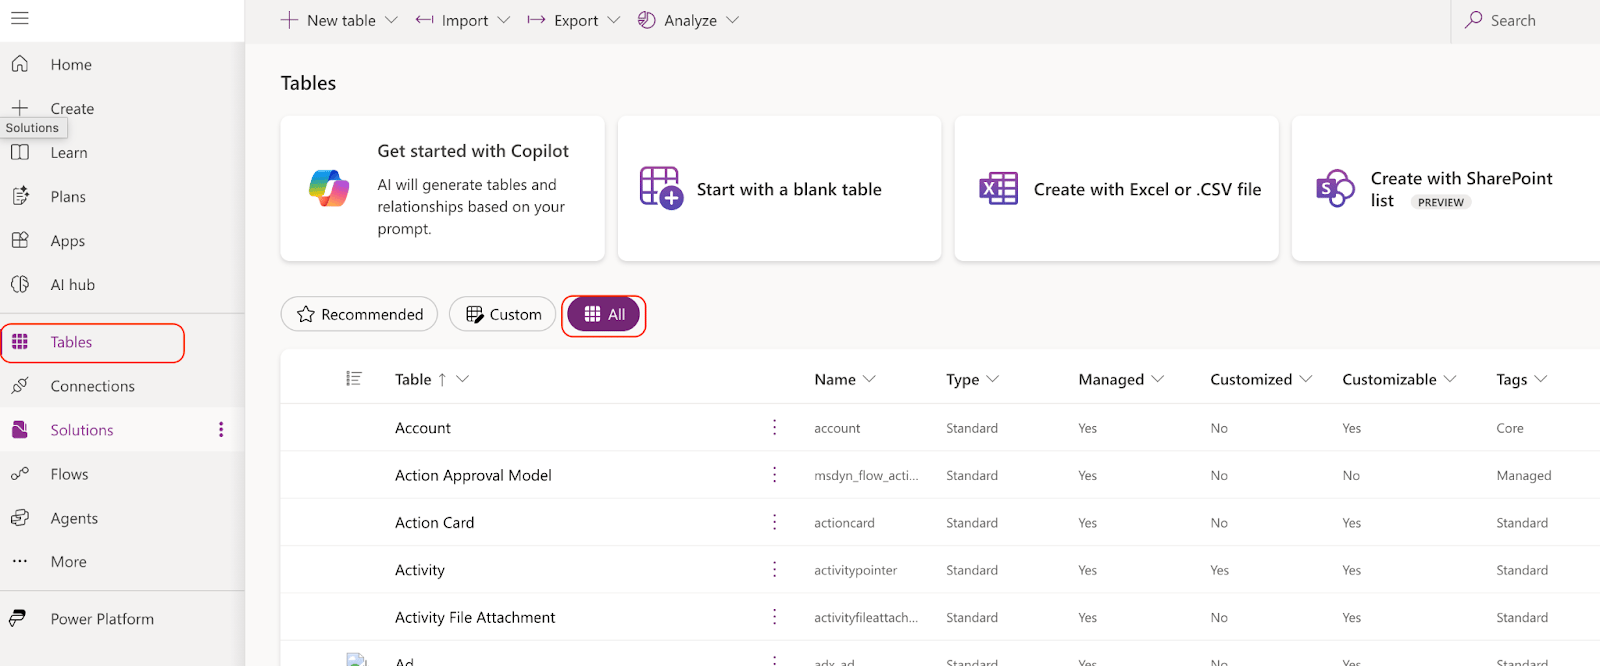
Make sure to choose All tables, in order to spot the conversationTranscript table
Unlike other extensive features in Azure which require setup, we can use it quickly and easily for heuristics and “behavioral breadcrumbs”. While Dataverse is limited in its use for analysis, we are stating it since it’s an always-on go-to feature from which we can get quick value.
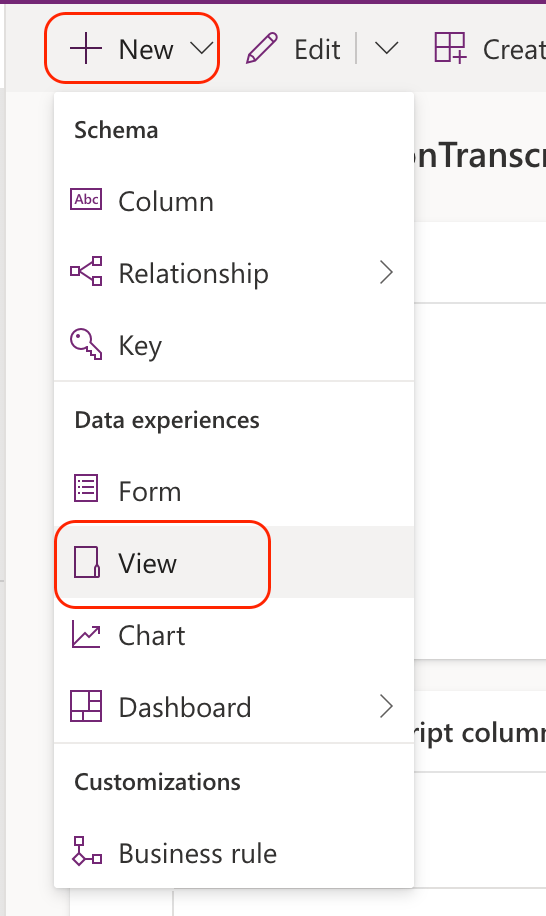
Dataverse tables are simple but powerful tools, and they are always active. We can create views which will essentially create pivot tables which will simulate grouped attributes according to the selected columns. We can also filter this data - effectively creating a query-like functionality.
To create a view, we just have to press New -> View:
Searching for anomalies
The key is to focus on intent, execution sequence, and outcomes, rather than infrastructure-level signals. The content column holds the thread for the entire conversation, meaning, we could deep dive into it for specific content detection:
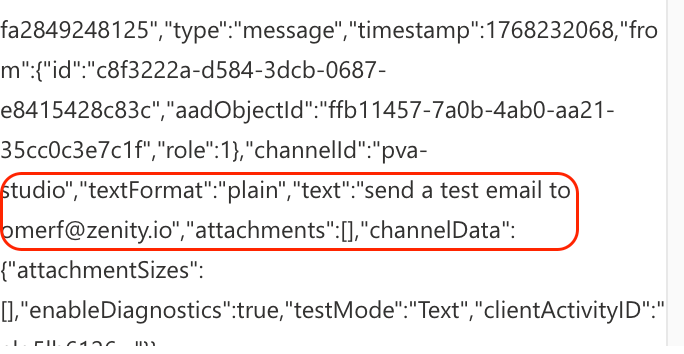
Let’s consider specific use cases with which we could use this:
Outgoing traffic to out-of-bounds domains
This goes far beyond filtering for user prompts - since the content field includes the entire thread activity, it’s a great place to filter known-bad or out-of-bounds endpoints or search for IOCs that could be used in tool invocation arguments.
We could filter this column on a tailor made view to show similar type of activity by users:
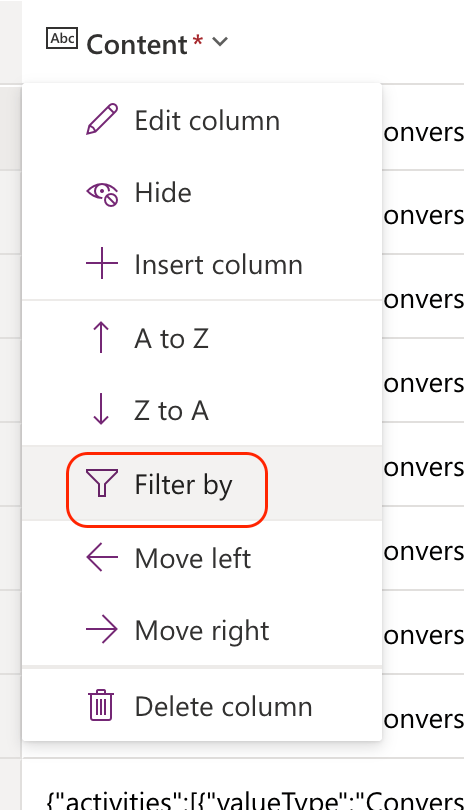
For example, we could look for unverified email recipients showing up in the tool invocation arguments:

Identifying anomalies should naturally be correlated with what the actions agent is expected to perform
In the context of the activity shown by GreyNoise, we can use this approach to detect additional out-of-bounds domains on various tool invocation types, similar to what was seen in the actual adversarial activity. This means both the mentioned *.oast domains, and other similar ones (e.g., ngrok.app; oastify.com).
To better understand this, let’s address 2 important aspects of Copilot Studio’s tools:
How an agent might reach out to these out-of-bounds domains
The most common way an agent can initiate outbound requests to callback domains is through predefined tools (previously called “actions” on Copilot Studio) that extend the agent’s functionality beyond text generation.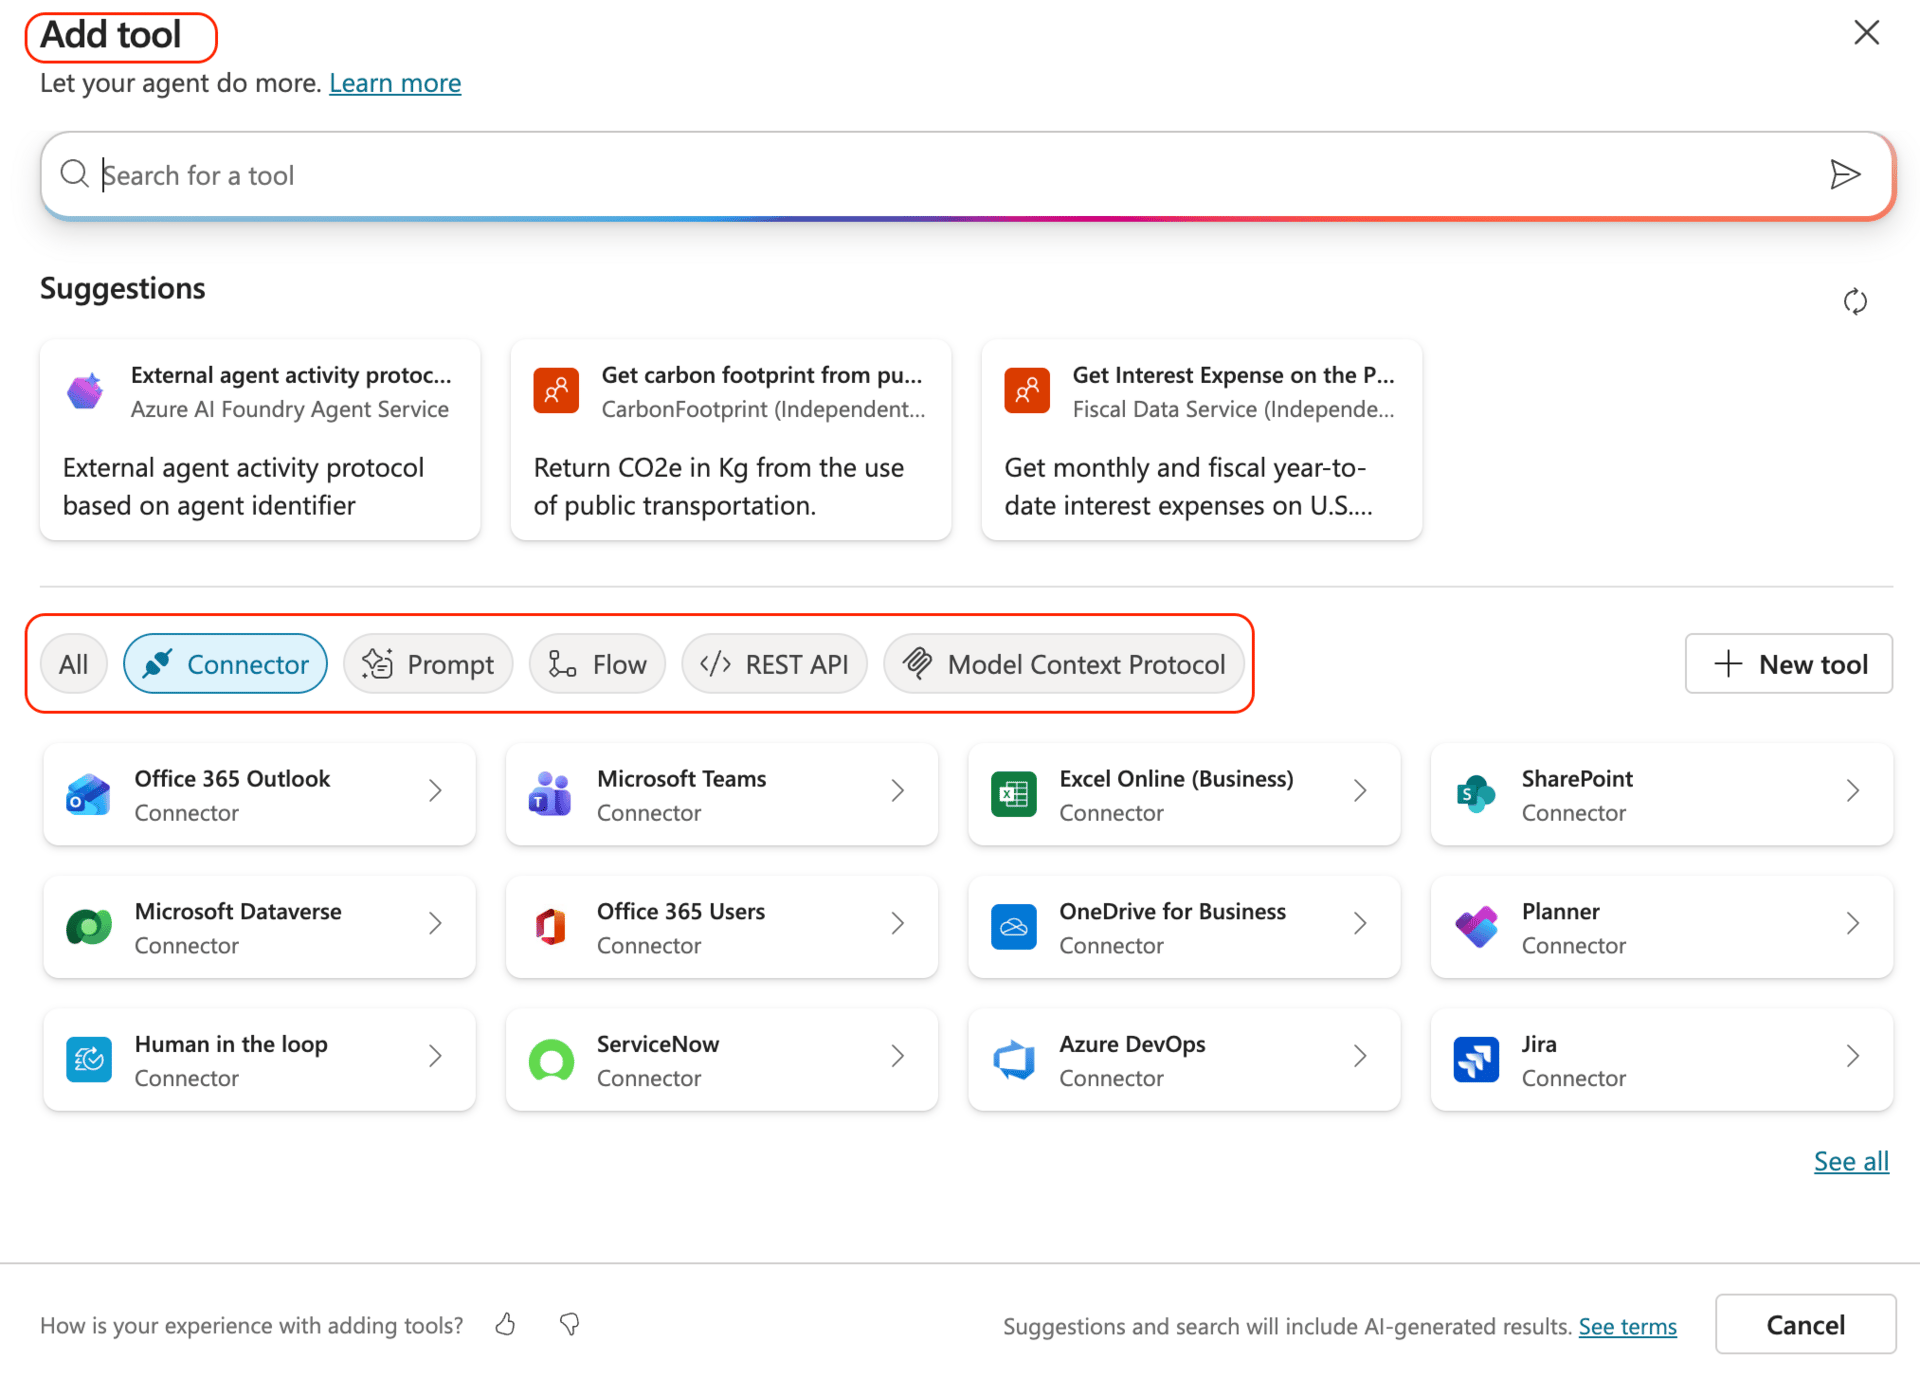
In LC platforms like Copilot Studio, tool invocation can also involve enterprise connectors (which are the data sources and functionality that the tools are configured to use). In practice, this means that:
Outbound requests may be executed using preconfigured enterprise integrations
The execution context can include organizational credentials or service identities
A successful callback may indicate not just network access, but access to trusted enterprise resources
As a result, a seemingly simple outbound request can have significantly higher impact than in a traditional stateless application.

When we define tools in Copilot Studio, we often also embed credentials to invoke them
Where in the audit logs data we should look for these domains
When investigating this activity, callback domains are most likely to appear in tool invocation arguments, rather than in the raw user prompt.
In Copilot Studio specifically, relevant audit and execution logs often include:
Tool or action request parameters, where externally supplied URLs are passed to connectors or actions
The TaskDialogId field, which typically contains a concatenated identifier in the format: [solution prefix][agent name][action].[action resource name]

Suspicious conversation sequences
These could indicate recon or exploitation attempts, can be detected by adding only the bot_conversationtranscript (effectively, the agent name) and ConversationStartTime columns (which we will also order by descending date), in order to detect multiple consecutive conversations on the same agent.

We can take agents showing suspicious behavior for close inspection
Recon prompts
Similar to what GreyNoise mentioned, these are tailor-made prompts used during the recon phase. What the attackers were really asking between the lines, are questions like:
Does this agent have basic functionality?
What can I invoke it to do?
What knowledge and knowledge sources could it expose?

We could use the observed recon prompts to learn more about what we can search for within the content field. Note that the above prompts shouldn’t necessarily be used verbatim, as searching for these prompts only would likely result in a high false positive rate. Our recommendation is to cross reference these prompts with the other malicious activity indicators mentioned above.
The threat actors are out there. How do we proceed?
The techniques described in this post are already being used in the wild. The question is not if agentic reconnaissance will occur, but whether you will detect it in time.
Key next steps for defenders:
Review your discoverable components
Create an inventory of what can be found externally: agents, metadata, integrations, middleware, registries, and embedded clients. Assume discovery is inevitable.Make observability a requirement
Enable logging for agent interactions, tool usage, APIs, and middleware, especially when you control the frontend or hosting layer. Observability should be intentional, not omitted during rapid or “vibe-coded” development.Turn threat hunting into continuous monitoring
Move from one-off investigations to ongoing detection of enumeration, capability probing, and abnormal agent behavior.Broaden AI security beyond models and prompts
Focus on AI systems as applications: their integrations, data paths, and deployment architectures - not just jailbreaks or model-level attacks.
Agentic security starts with visibility. You cannot defend what you cannot see.
Reply